Don't Miss: Where The Major Currencies Will Be Moving In 2022 - Yearly Forex Outlook & Scenarios For EURUSD, GBPUSD, USDJPY
US Dollar Fundamental Outlook: NFP Miss Prolongs USD Consolidation but Bull Trend May Soon Be Ready to Continue
In a generally slow first trading week in 2022, the Fx market got a stir on Thursday and Friday from US data releases. Namely, the misses in the ISM services PMI on Thursday and the Nonfarm payrolls on Friday were a cause for some disappointment for USD bulls.
Nonfarm payrolls came below expectations quite substantially with an actual print of 199K, while consensus forecasts expected 400-500K. The ISM services also fell more expected to 62 from the very high reading of 69 the previous month. If the data had beat the estimates, we would likely have gotten a USD break to the upside. But, in this way, the NFP and ISM misses have likely led to the current prolongation of the consolidation.
However, despite these shortfalls in the data, the overall implications are still of a healthy US economy. For instance, the unemployment rate fell more than expected to 3.9%, and average hourly earnings (wage growth) beat estimates. It’s worth a reminder that the Fed considers full employment a state with unemployment rates below 4%. That goal has now obviously been already achieved, less than two years into the pandemic. Hence, this is another green light for the Fed to press on the hawkish pedal, and there is little to stop them from proceeding with their tapering and tightening plans. The hawkish Fed should continue to support the dollar, likely leading to an eventual break higher in the DXY index and a break lower in EURUSD.
The central focus on this week’s US calendar is the CPI inflation prints on Wednesday. Both the headline and core figures are expected to come in hot, which should keep Fed tapering and tightening prospects in place. Potential upside surprises in the CPI numbers would likely lead to USD strengthening as this will further increase the pressure on the Fed to act earlier and swifter.
Euro Fundamental Outlook: Neutral EUR Stays in Its Broader Ranges; Economic Calendar is Quiet This Week
The common European currency continues to trade inside its broader ranges, stronger versus some and weaker versus other currencies on a relative basis. However, it has been in a consolidative range since late November against its most important counterpart – the US dollar. Indeed, the EURUSD pair is a proxy for overall demand for both euros and US dollars in the Fx market. Thus when EURUSD is falling, it is often accompanied by a broadly strong dollar, while the opposite is true when EURUSD is rising (broadly strong euro).
The key (and only) data piece from the Eurozone last week was Friday’s flash CPI release. It printed slightly higher than consensus forecasts, however, the market doesn’t want to pay too much attention to it because it is largely driven by base effects (German tax hike), which are expected to start fading from the next CPI release. Hence, unlike the Fed, the ECB is not under pressure to think about tightening policy during 2022.
This week’s Eurozone calendar is quiet, which should leave EUR exchange rates to be mainly influenced by overall risk sentiment and specific developments with other currencies.
EURUSD Technical Analysis:
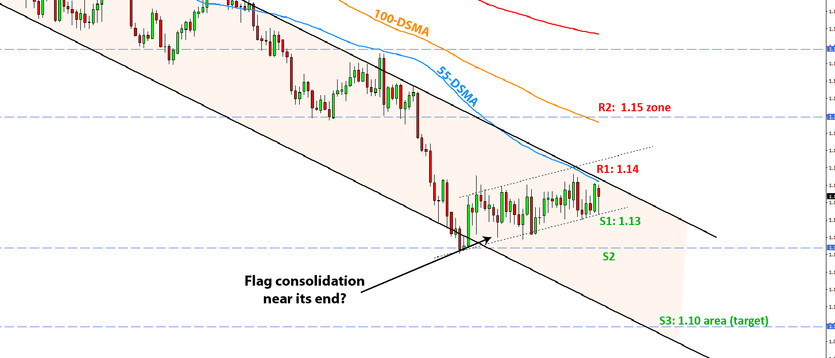
EURUSD has been consolidating in a flag-like pattern for more than a month and is now coming near the resistance line of its downtrend (channel). At the same time, the consolidation has lessened the oversold conditions entirely, suggesting that the bear trend may be ripe for continuation (daily RSI is near 50 now compared to 25 in late November).
In this context, the first key resistance to watch is the 1.14 zone where is the channel’s upper end (falling trendline) converges with the 55-day moving average (blue line). However, as sexy as the channel and the flag pattern appear, it’s possible that EURUSD may break above this 1.14 resistance zone and still not break the bearish trend. Under such a scenario, the next resistance zone to watch would be 1.15.
To the downside, the first important support is located around 1.13, at the lower end of the consolidative flag pattern. A sustainable break here will signal that the bears should have no problem taking EURUSD below the November 24 low of 1.1185. In this scenario, the bear trend-channel projection points to the 1.10 area as the next destination for EURUSD.
British Pound Fundamental Outlook: GBP Appreciates in December, What is Next?
That surprise December rate hike from the BOE seems to have finally fed into some GBP appreciation. Namely, the pound was the second best-performing currency for December, rising against all major currencies except for the Australian dollar (GBPAUD ended December close to unchanged).
However, following the recent rise, GBP may now want to spend some time in consolidation. The market will probably want more confirmation from the BOE that more rate hikes are coming before taking GBP further higher. In the meantime, until we get any such hints or confirmation (e.g., speeches/comments from BOE officials), it is reasonable to expect some range trading or retracement for sterling in the current context.
On the calendar, the highlight is on Friday with several economic releases from the UK, including most importantly, the GDP report, and industrial and manufacturing production data. However, as this week’s economic reports are unlikely to be market moving in a big way, traders’ attention will instead likely turn to scheduled releases for the week after, which sees high-impact data like CPI inflation and employment. From there, the next Bank of England meeting on February 3 is not far.
GBPUSD Technical Analysis:
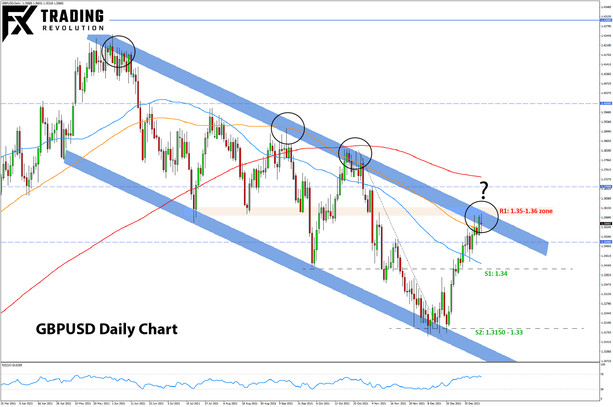
After rebounding at the lower end of the channel formation at the 1.3150 - 1.33 area, GBPUSD has climbed to 1.35, exactly as anticipated in our weekly posts last month. Now it has reached and already tested the upper line of that same channel formation.
In this context, the main question for traders is whether the channel still holds or breaks? GBPUSD will likely be heading back lower if the channel resistance trendline holds, with the 1.34 technical zone being the nearest support of note. In this scenario, the next support zones lower will be the same old 1.3150 - 1.33 area that held in December.
Conversely, GBPUSD would break the channel’s upper in the 1.36 zone if a bullish scenario instead comes into being. In this case, big upside potential would lie ahead with the nearest next resistance zones higher located at 1.38 and then 1.40.

Japanese Yen Fundamental Outlook: Treasury Yields & Stocks Are Pulling JPY in Opposite Directions
US yields rose strongly last week and eclipsed the previous swing highs from March and October 2021. However, Wednesday was an interesting day when JPY was pulled in different directions by its two main drivers, yields and risk sentiment. Namely, 10-year Treasury yields rose strongly last Wednesday, but risk sentiment suffered as stocks tumbled, resulting in a largely neutral day for USDJPY on January 5.
What’s more important perhaps is that stocks have continued to fall since then and USDJPY has followed lower (S&P 500 testing key support this Monday, Jan 10). While the USDJPY decline off the highs is only modest so far (around 100 pips), traders will remain on watch for a possible snowball effect in equities. Overall, the JPY should stay weak as long as Treasury yields keep rising and don’t cause a big stock sell-off. However, that is the big risk for JPY crosses - that if stocks sell off hard, it will likely feed into notable JPY strength due to risk aversion flows.
USDJPY Technical Analysis:
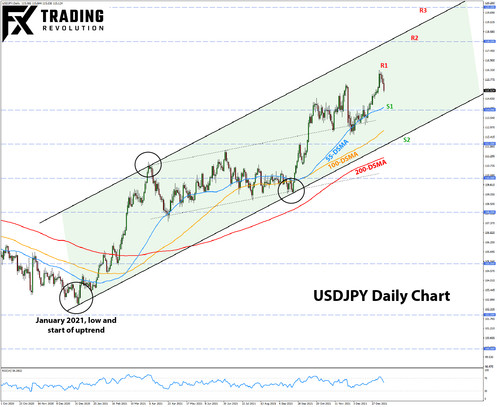
The zoomed-out daily USDJPY chart we provide below shows a detailed view of the uptrend here. A path toward 118.00 and 120.00 can be clearly seen here. Remember, these are two key resistance areas for USDJPY on the monthly chart, as we recently discussed in our yearly Forex outlook for 2022 (see here).
After recently trading in the upper part of the rising 1-year channel, USDJPY is now coming back to the mid-point of this formation, perhaps as part of another retracement within the trend. In this sense, the 55-day moving average is the first level of note. It is also located close to the 114.00 level, making this area the first notable support for USDJPY.
To the upside, the most recent high at 116.34, albeit an insignificant one, is in focus as the first resistance. Of course, as mentioned earlier, the critical resistance zones are 118.00 and then the big one at 120.00.


