USD Fundamentals: Packed Fx Calendar; CPI Inflation and Fed Meeting Take Center Stage
The dollar is in consolidation mode at lower levels, with the broad DXY index trading in the 104.00 area after only making a marginal rebound last week on the better-than-expected US data. For instance, the ISM services index at 56.6 was much stronger than the estimates of 53.5. Additionally, the PPI inflation measure and the University of Michigan (UoM) inflation expectations both also surprised higher.
Yet, despite all this “bullish” USD data coming only days after the also strong Nonfarm payrolls the week before, the market seems unpersuaded to resume the USD uptrend from earlier this year. The dollar is still trading near the recent lows, with EURUSD hovering in the 1.05 - 1.06 area. In our previous weekly Fx from last Monday, we said the current low USD levels are fundamentally unjustified, and the US economic reports released last week only confirmed that.
The attention now turns to this week’s critical events: the CPI inflation tomorrow (Tue) and the Fed meeting the day after (Wed). Both will be equally significant events, likely causing a big spike in Fx volatility this week.
Dollar bears are hoping for another miss in the CPI report, while dollar bulls hope for an upside surprise or at least a match of consensus expectations, which are standing at 7.7% y/y for the headline CPI and 6.1% y/y for the core CPI. The release of the CPI report on November 10 caused a 200 pips volatile spike in EURUSD. It could be the same tomorrow. The only question is the direction (whether USD higher or lower).
The Fed meeting on Wednesday may only come as an extension of the volatility. How much volatility the FOMC causes will depend on the decisions they make and communication from Chair Powell in the press conference. The Fed also releases the closely watched economic projections at this meeting (so-called “dot plots”), which pretty much guarantees volatile trading around the event.
On balance, with the USD at these levels, the probabilities seem skewed more toward a USD rebound than an extension of the losses. The dollar has already fallen a lot since the September highs, and the markets have already gone a long way toward pricing in the peak in inflation and the end of Fed rate hikes. Barring a huge miss in the CPI inflation report tomorrow, it seems highly unlikely that the Fed will be able to give any dovish hints on Wednesday, with inflation still running above 7%. In line with this, it’s that much less likely that the dollar can extend the decline from here. Let’s see what happens in what is likely to be an interesting and surely volatile Fx week.
EUR Fundamentals: Focusing on ECB Meeting (Thur) and Flash PMI Reports (Fri)
No currency in the Fx market this week will be spared from high volatility. The busy Eurozone calendar has Thursday’s ECB meeting in the spotlight, while the German ZEW index on Tuesday and the flash manufacturing and services PMIs on Friday will also receive a lot of attention.
The main theme driving the euro in recent months has been the “peak inflation” narrative and a seeming perception that the European energy crisis won’t cause a very deep recession in the end. As a result, the EUR currency has rebounded materially since the September lows, which is evident not only in EURUSD but also EURCHF and EURJPY.
The question is, can this theme of EUR-optimism continue? The answer is probably not for much longer. First, the potential for further EUR gains is now much smaller after such a notable appreciation already. Second, the renewed rise in European gas (TTF contract) and electricity prices to painful levels is a factor that should act as a big headwind. Third, we are yet to see the worst of the incoming recession caused by the energy crisis in Europe. All of this together suggests EUR declines are more likely from here than an extension higher.
As for the ECB meeting this Thursday, unlike the Fed, the ECB is likely to generate much less volatility and attention. The reason is quite simple: the ECB pretty much has its hands tied. The inflation in Europe is different from the US and with much “weaker” breath than in the US.
This means that if US inflation starts falling fast from here, then Eurozone inflation will probably fall even faster and further. In turn, if the Fed “pivots’ dovishly because inflation has peaked, the ECB will surely need to turn dovish even more aggressively for similar reasons. All in all, this dynamic should re-emerge as a bearish EURUSD driver over the longer term.
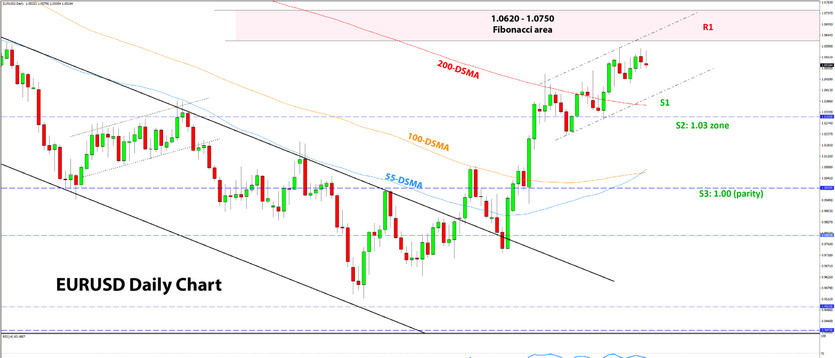
EURUSD Technical Analysis:
EURUSD continues to trade above 1.05 and coming close to 1.06 but never actually reaching it. So far, each attempt has been rejected below 1.06.
By the look of it, the action on the charts suggests the top may be near, but with a possibility that EURUSD makes an attempt above 1.06. The case for this is also confirmed by the existence of an important Fibonacci area just above 1.06. It is often the case that Fx pairs enter a strong Fibonacci area only briefly before reversing. This results in grabbing the stop losses (usually of small retail traders) just above the important chart zone before the market continues in its intended direction.
As discussed last Monday, the Fibonacci confluence zone is located at the 0620 - 1.0750 area. Significant past lows (from Covid March 2020 crash) also concur here with the Fibonacci levels. It will be no surprise if the current juncture proves as the “perfect setup” to re-enter short EURUSD. A bearish signal or pattern on lower timeframes could give an early hint whether the pair will test further higher to 1.0750 or reverse sooner.
To the downside, the 1.03 – 1.0350 zone is the first support ahead of parity (1.00).
GBP Fundamentals: Sterling Looks Vulnerable Going Into an Eventful Trading Week
Following two light weeks on the UK calendar, this one will certainly make up for the time of low volatility previously. The Fx calendar is extremely packed this week, with data release dates moved forward as we are approaching the Christmas season when most traders will take days off for the holidays.
The UK calendar features employment data (Tue), CPI inflation (Wed), and retail sales, as well as manufacturing and services PMIs (Fri). However, the Bank of England meeting will be the main focus for UK and GBP markets this week.
Like the ECB, the Bank of England has its hands tied to a large degree. The economy is slowing into a recession, and their rate hikes to bring inflation down will only add to the economic pain. Like the rest of Europe, the big spike in CPI inflation is not due to demand factors that are usual in a strong economy. Instead, the energy crisis is causing the largest part of increases in CPI inflation in the UK, just like it does across the rest of Europe.
Overall, the weakness of the economy is likely to transpire into a weaker pound eventually, especially versus currencies that are likely to remain firm during times of risk aversion (such as USD, CHF, and now JPY also). This means downside risks to pairs like GBPUSD, GBPCHF, and GBPJPY, while EURGBP may stay range-bound as the euro is likely to also stay in the group of “weak” currencies.
Another big driver of GBP moves that we must keep on our radar is the global macro and the risk environment. Given central banks’ strong determination to violently crash inflation down with restrictive monetary policy, risk appetite should remain suppressed over the coming months. This (assuming risk aversion eventually returns) should prove bearish GBP in the coming weeks and months.
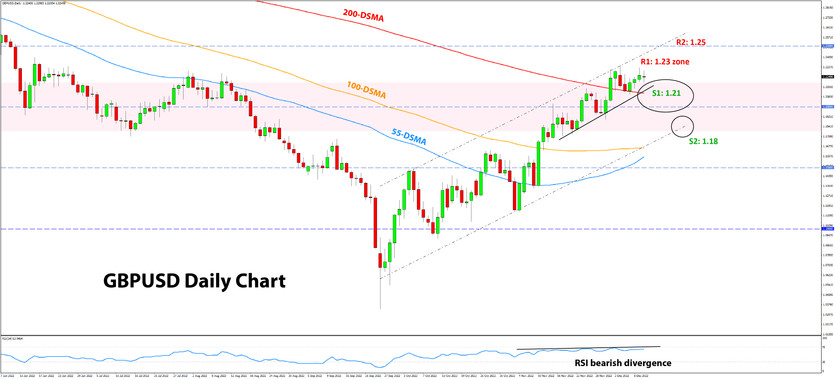
GBPUSD Technical Analysis:
GBPUSD also continues to trade at high levels around 1.2250, and – similarly to EURUSD – with potential for a further upside test toward the 1.23 area. But like EURUSD, the resistance here is likely to be strong, and the market action on the chart suggests the upside momentum is waning. This is evident on the RSI indicator also, which shows bearish divergence already exists on the daily chart (see below).
As mentioned, the 1.23 area is the first resistance to the upside. If GBPUSD moves above it, the focus will then turn to 1.25.
To the downside, the nearest (moderate) support exists at the 1.21 zone. This is better visible on intraday timeframes (like 4H). Below it, the 1.20 level will come into focus, but it doesn’t seem like the most pivotal level in the current context on the daily chart (see below). The next support down is 1.18, which is the support line of the rising channel formation and the confluence of the 100-day and 55-day moving averages (orange and blue lines).
JPY Fundamentals: US Treasury Yields Rebound May Transfer Into USDJPY Rebound
The yen was on the back foot last week due to various technical factors and as US Treasuries rebounded modestly. Both USDJPY and the 10-year US Treasury yield are at an important support area, and both are recovering only marginally so far. The current eventful and volatile week could prove rather decisive for both Treasuries and the yen.
What happens next with US Treasuries, of course, remains the primary focus for JPY traders as monetary policy in Japan is fixed at 0% rates. In this sense, if the 10-year US Treasury can make another move toward 4.0% or the highs at 4.3%, then USDJPY is likely to follow with a similar upside move.
On the domestic Japanese front, the BOJ meeting will take place next week on December 20. No big changes from the BOJ are expected yet, but it’s worth keeping in mind that Governor Kuroda’s term ends in April next year, and this will be one of the last BOJ meetings he leads. His successor may be announced at any time between now and then, and that could be a source of volatility on JPY pairs. Particularly, the question many will ask is, will the new Governor want to continue the uber-dovish policy that the BOJ pursued under Kuroda?
In the short term, USDJPY may continue to recover some of the recent losses and move closer to 138.00 - 140.00 as traders scale back positions ahead of the Fed meeting this Wednesday.
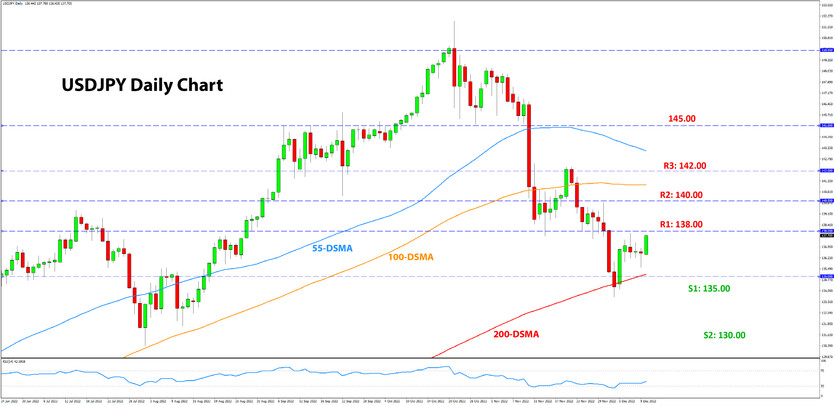
USDJPY Technical Analysis:
USDJPY was able to bounce from the 135.00 area last week and is now trading above 137.50 as we enter the new 5-day trading period. Interestingly, the technical picture has gained some more clarity recently, with distinct support and resistance zones near current levels.
For example, to the upside from here, there are established resistance zones at 138.00, 140.00, and 142.00 (see chart below). USDJPY is likely to react to each of these if or when it reaches them. A break above the nearest resistance at 138.00 should likely result in a quick continuation to the next one at 140.00.
To the downside, the 135.00 low from last week is the first support. In the larger, longer-term context, the 130.00 area is the next support down.