Traders have to make use of indicators in order to use proper strategies and make successful trades in the market; these indicators are statistical tools that let them make critical decisions about the heading direction of a currency pair.
There are many indicators that give access to traders, depending on the strategy that fits them the most, going from confirming indicators, leading indicators, relative strength index, etc. and here, you'll find some of the most used forex indicators which always give great profits when used right.
While there isn’t a “best” forex indicator, there are indicators that fit better in different market conditions, like the ones below.
A Moving Average will give you the feeling that "trends are friends" by using the moving average ( MA ) to define and approach a long-term trend.
What you need to do is, for example, if the price goes above the 200 Moving Average , look for a long go. But if the price is below the 200 Moving Average , it will be time to look to short.
There are different Moving Averages , but many users go for the 200MA because it's a summary of what the price has done over the last 200 candles.
What many users do as well is setting a trailing stop loss to avoid a limit on their profit potential; by adjusting the stop loss in the direction of the trend, you'll have the market moving on your favor.
The Average True Range can be used to measure the volatility of the market .
One of the bases of the ATR is that, if the Average True Range has a low value, it tells you the market has low volatility and then it goes the other way then it's not.
What you want to do with the Average True Range is to determine the ATR value and add the ATR above the highs of resistance, giving your stop loss a buffer, keeping it away from support/resistance.
Many users know that the market often moves from low to high volatility and then back to normal, so you need to wait for the ATR value to approach the low volatility and check if the market is in a range; if the price breaks out of the range, you'll get momentum to continue.
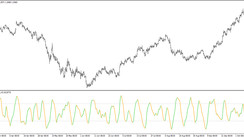
You can also go for a momentum indicator like the Stochastic , which, according to his creator, “ measures the momentum of price ", and it would be giving you some ideas of what would happen to it.
If you see it's going up really fast and in a surprising way, it must slow down before turning things around.
The Momentum price should "always change direction before price”, so what you need to do is track the momentum of price and identify when the price is gaining or losing its momentum.
You can get the most out of the Stochastic indicator by trading in the direction of the long-term uptrend; wait for the price to reach oversold levels on the indicator, and wait for an entry trigger to get long. Then, go the other way around when it comes to a downtrend.


