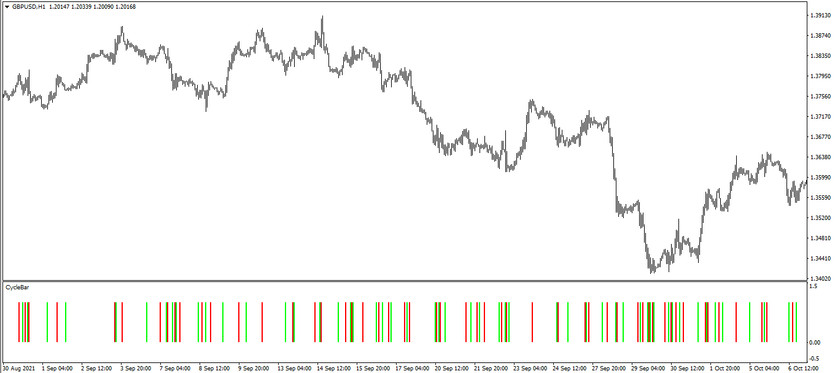
The Cycle Bar indicator is a trading combination based on the functioning of two indicators: RSI and MA, included in the standard forex set. This algorithm was based on the functioning of trend indicators, and therefore the Cycle Bar is used only for trading during a certain trend, direction and the strength of which is determined using the indicator values, as well as the very moment of entering the market. It is represented in the lower window of the price chart as several columns of a certain color. A change in their color is considered as an indicator signal.
The Cycle Bar indicator can be used on any timeframe, with any currency pair.
Input parameters
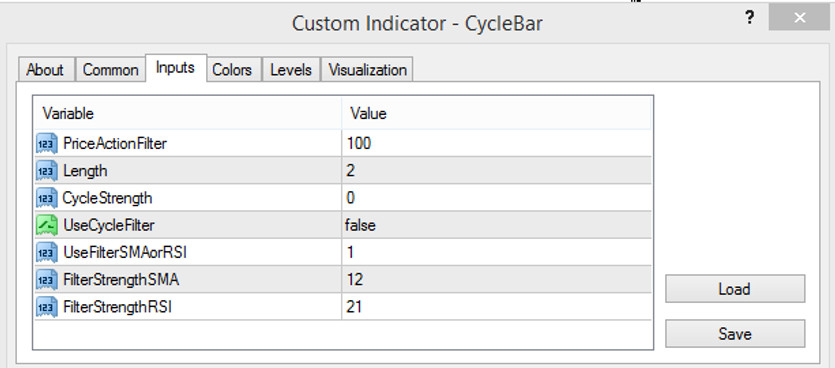
The Cycle Bar indicator settings consist of several sections. For example, the Input Parameters section affects its technical operation, while the Colors section is responsible for its visualization, namely the color and thickness of the columns. Using the Levels section, signal levels can be added to its window.
- PriceActionFilter - parameter responsible for the functioning of the current price filter. The default value is 100.
- Length - column length parameter. The default value is 2.
- CycleStrength - the strength of the current indicator values. The default value is 0.
- UseCycleFilter - parameter responsible for using the signal filter of the Cycle Bar indicator. The default value is false.
- UseFilterSMAorRSI - used filter period for SMA and RSI indicators. Default value is 1.
- FilterStrengthSMA - MA indicator strength filter. Default value is 12.
- FilterStrengthRSI - RSI indicator filter strength period parameter. The default value is 21.

Indicator signals
The Cycle Bar indicator, thanks to its simple and clear visualization, is very easy to use and suitable even for beginners. To open a certain trade, the indicator generates a signal based on the functioning of the RSI and MA. And thus, draws columns on the chart that determine the current trend. If the current trend is upward, long positions are opened, if the trend is downward, short positions are opened. In both cases, trades are closed when the trend changes or there is no trend.
Signal for Buy trades:
- In the indicator window, a color column with the growth value is formed.
When such a column appears on a signal bullish candle, a buy trade can be opened, due to the presence of an uptrend in the current market. Such a trade should be closed after a new column appears in the indicator window. At this moment, it can be considered opening new trades, the direction of which depends on the colors of the current column.
Signal for Sell trades:
- A column with the value of the fall appears under the signal candle.
A sell trade can be opened immediately when such a column appears. At this moment, a downtrend is determined on the market. Such a trade should be closed when the next column is formed, which in turn will allow considering the opening of new trades.
Conclusion
The Cycle Bar indicator is a very simple, yet very accurate and effective indicator, which is great for use in trading strategies. Although the indicator is very easy to use, preliminary practice on a demo account is recommended. This will not only strengthen the current trading skills, but also to use the indicator correctly.
You may also be interested The Fast Slow SAR Arrow trading indicator for MT4


