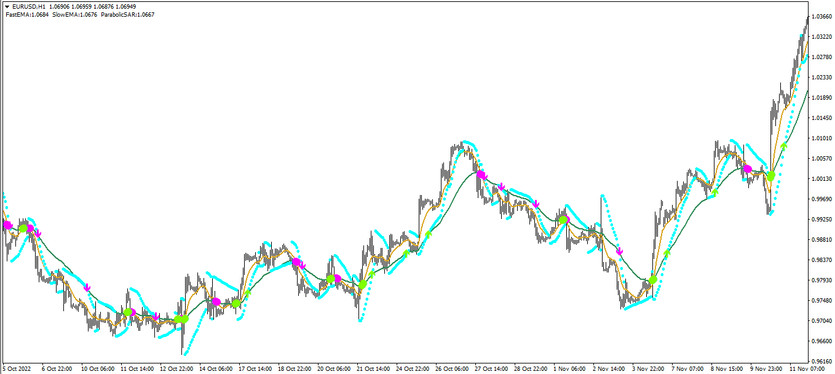
The Fast Slow SAR is a developed trading algorithm based on joint calculations of two standard Forex indicators. To generate signals, the indicator uses the Parabolic SAR direction and the intersection of the fast and slow EMA, which in turn is a very strong signal to enter the market. Thus, taking into account the current market trend, the indicator also determines the direction of current trades. It is displayed directly on the price chart in the form of the Parabolic SAR itself with two moving averages, at the intersection of which a dot appears, and later an arrow of a certain color and direction, which in turn and will be the indicator signal.
Fast Slow SAR is suitable for use with any currency pairs and timeframes.
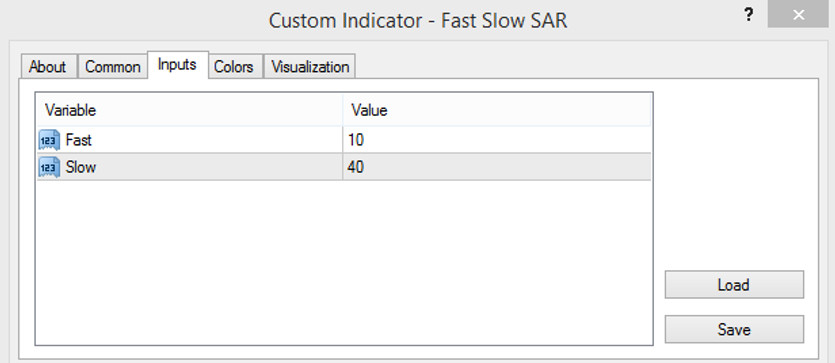
Input parameters
The Fast Slow SAR indicator settings consist of several sections. For example, the Input Parameters section affects the execution of technical work, while this section consists of only two items. The Colors section is responsible for its color gamut and value thickness.
- Fast - value of the period of the fast exponential moving average of the indicator. The default value is 10.
- Slow - parameter responsible for the period of the slow moving average. The default value is 40.
Indicator signals
Using the Fast Slow SAR indicator is not difficult and requires special trading skills, since the indicators on which it is based are included in the standard Forex set and are very easy to use. In addition, the indicator has a very convenient and understandable visualization. To open a certain trade, it should be determine the direction of the current trend using the intersection of the moving averages and the location of the Parabolic SAR. If the trend is upward, long positions are opened, if the trend is downward, short positions are opened. To open a trade,it should be waited for the formation of an arrow on the chart. Positions should be closed when the direction of the current trend changes.
Signal for Buy trades:
- Moving averages intersect so that the fast one is higher than the slow one. At the same time, the Parabolic SAR points are under the candles. At the place of their intersection, a point with a growth value appears, and later an arrow pointing up.
Upon receipt of a combination of such conditions, on a candle confirmed by an arrow, a buy trade is opened, due to the presence of an uptrend in the current market. Such a trade should be closed when the current trend changes, namely at the moment of the next intersection of the lines. At this moment, it can be considered opening new trades.
Signal for Sell trades:
- Parabolic SAR dots form above the candles. EMA lines cross and the slow one is above the fast one. A drop value point should form here, followed by an arrow pointing down.
A sell trade can be opened immediately after such conditions are received on a candle, confirmed by an arrow. It should be closed when a reverse crossing of the moving averages is received, at this moment a change in the current trend is expected, allowing to consider opening new trades.
Conclusion
Although the Fast Slow SAR algorithm is very simple and easy to use, it is very profitable and efficient. In addition, its visualization is very easy to learn and therefore the indicator is suitable even for beginners. However, prior practice on a demo account is recommended before trading on a real deposit.
You may also be interested The TTM SSA Bars TT Arrow trading indicator for MT4