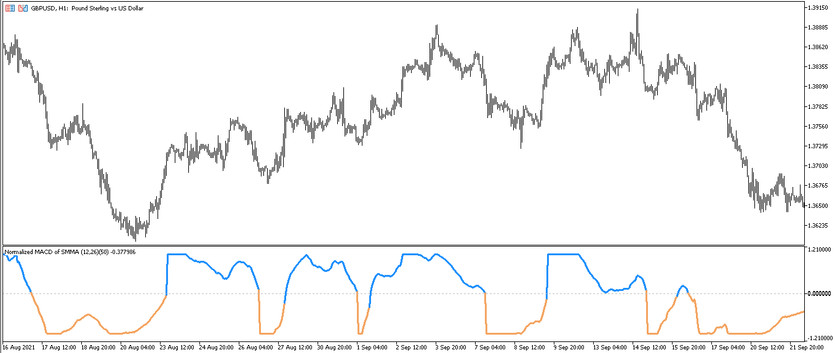
The Normalized MACD of Averages trading indicator is an algorithm based on a modification of the standard MACD indicator with the addition of an additional filter of the Moving Averages (MA) indicator. The indicator was developed to determine the current market trend and its strength, or its temporary absence. This information is about the current market, allows considering the opening of trades, the direction of which, in turn, determines the current trend. Normalized MACD of Averages is presented in the lower window of the price chart as a solid line, which, under certain market conditions, is painted in one of three colors and moves up or down relative to the signal level 0. These parameters of the indicator line serve as the main indicators of the current market situation.
The Normalized MACD of Averages indicator is suitable for trading on any timeframes, using any currency pairs, as it works equally effectively when choosing any units.
Input parameters
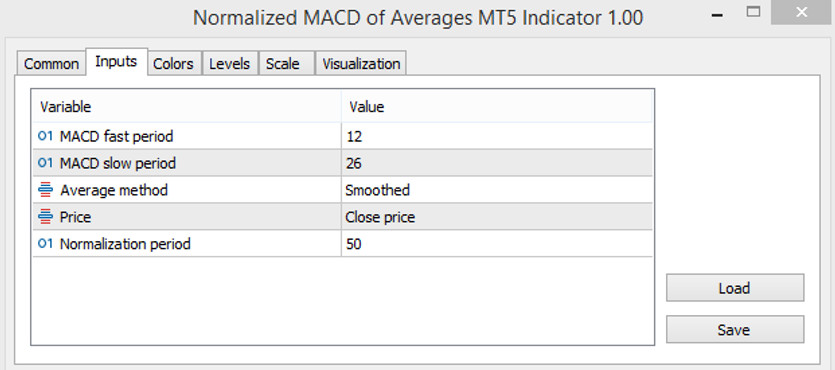
The Normalized MACD of Averages indicator settings consist of five input parameters that are used to correctly adjust the indicator to its own trading algorithm, that is, its input parameters directly affect its operation. The Colors section in its settings is used to select the color scheme and line thickness, and the Levels - to add signal levels indicator to the window.
- MACD fast period - the value of the period of the fast moving average of the MACD indicator. The default value is 12.
- MACD slow period - the period of the slow moving average of the MACD indicator. The default value is 26.
- Average method - type of moving average used as the basis for indicator calculations. The default value is Smoothed.
- Price - type of the price to which the general calculations of the indicator are applied. The default value is Close price.
- Normalization period - value of normalization of general indicator calculations. The default value is 50.

Indicator signals
The Normalized MACD of Averages indicator works according to a very simple principle. To open a certain position, it is first needed to determine the current trend. This is done using the indicator line, namely, taking into account its parameters. If the line moves up and rises above level 0, and at the same time it has a color with a growth value is an upward trend and buy tardes are opened. And if the indicator line has a color with a falling value and moves down, below the 0 level, the trend is down and sell trades are opened. However, if the indicator acquires a neutral hue regardless of the direction of the line, trades do not open at all.
Signal for Buy trades:
- The indicator line has a color with a growth value and moves up, rising above the signal level 0.
Upon receipt of such conditions, a long position may be opened on the signal candle, due to the presence of an uptrend in the market. The trade should be closed after determining the change or complete end of the current trend, namely, after the indicator line changes color and direction. At this moment, it is recommended to consider opening new trades.
Signal for Sell trades:
- The indicator moves down, crossing its level 0, while it is colored with the value of the fall.
A sell trade can be opened immediately after receiving such conditions, which characterizes a downward trend in the market. Such a trade should be closed after the indicator line changes color and direction. At this moment, a change or end of the current trend is determined, which will allow considering the opening of new trades.
Conclusion
The Normalized MACD of Averages indicator is a very efficient and accurate trading algorithm that serves to determine the current trend and trade in this period. In addition, it is very easy to use and does not require special skills in its use, a little practice on a demo account will be enough, which will allow developing trading skills and learning how to use the indicator correctly.
You may also be interested The RSI Swings trading indicator for MT5


