Like many professions, entering the trading business requires a lot of hard work and learning, which can initially appear to be very difficult for newbies.
There are a lot of factors and aspects about the Forex market that traders ought to master in order to be profitable.
One of those, and also one of the most widely used techniques in the trading world, are the so-called Overbought and Oversold values.
These two terms describe their function very well.
Overbought values describe a period of time where there has been a significant and consistent upward move in the price over a period of time without much retracement.
While the term Oversold describes a period of time where there has been a significant and consistent downward move in the price over a period of time without much pullback.
Using the Williams %R indicator is one of the ways how you can identify whether a particular currency pair is Overbought or Oversold in order for you to identify the possibility of a counter move.
Including Williams %R indicator in your trading strategies will help you to more successfully day trade the Forex market. Williams %R is one of the most effective indicators when it comes to Overbought and Oversold readings, as well as trend momentum confirmations and failures.
Using the %R Williams Indicator
Implementing the Williams %R indicator in your trading rituals is not a particularly difficult task. In fact, it’s more or less similar to trading the other popular momentum oscillators like the RSI or the Stochastic , which are also most often used to look for overbought and oversold values.
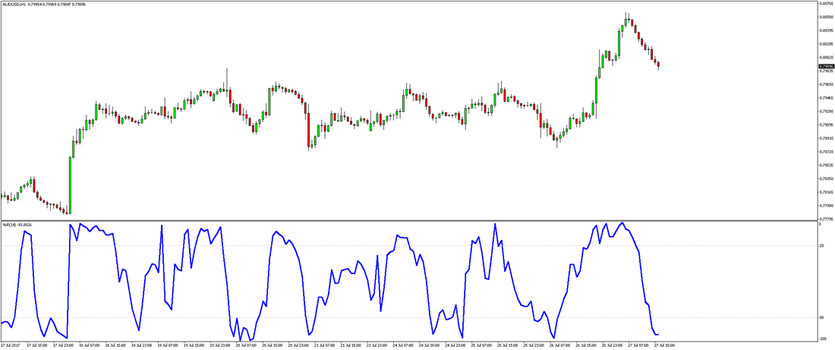
The Williams %R indicator fluctuates between -100 and 0, unlike the other momentum oscillators that usually only produce positive value readings. This is due to the calculation formula of the %R indicator, but nevertheless, the actual number is not that important, rather it’s the meaning of those numbers that is of interest to Forex traders.
As per the Williams %R indicator, a Forex pair is considered overbought when the indicator is above -20, and oversold if the indicator is below -80.

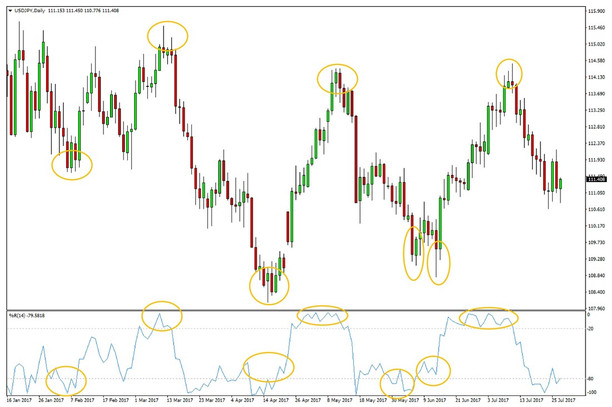
Daily USDJPY chart – Peaks and Troughs were indicated by extreme values on the Williams %R indicator
Traders will look to sell a currency pair when the %R reading is above -20 and they will look to buy it when the indicator is below -80. This can be a particularly successful strategy in ranging markets as the price ping-pongs between two horizontal support and resistance levels.
On the USDJPY chart above, this kind of situation is shown, where the price trades in a range and the Williams %R indicator is placed underneath. It can be observed that the %R indicator accurately identified the tops and bottoms in the pair for most of the time period shown on this chart.
Still, it doesn’t mean that every reading above or below the extreme levels is a buy or sell signal. During strong trends, the indicator can remain stuck at overbought or oversold levels for a prolonged period of time while the trend continues to run. Trading solely on overbought/oversold indicators can, therefore, lead to losses in those kinds of situations.
Traders are better off to use other technical and fundamental tools in conjunction with the Williams %R indicator and the overbought/oversold signals it generates. Any trading signals that are generated from any of the tools can be vindicated by the other tools in the trader’s arsenal.
The Williams %R indicator once understood and mastered is a very useful tool in timing entry and exit points in the Forex market. Aside from its primary use to measure overbought/oversold values, it can be also used in more advanced methods such as divergence and momentum trading.


